
DOTS
2015
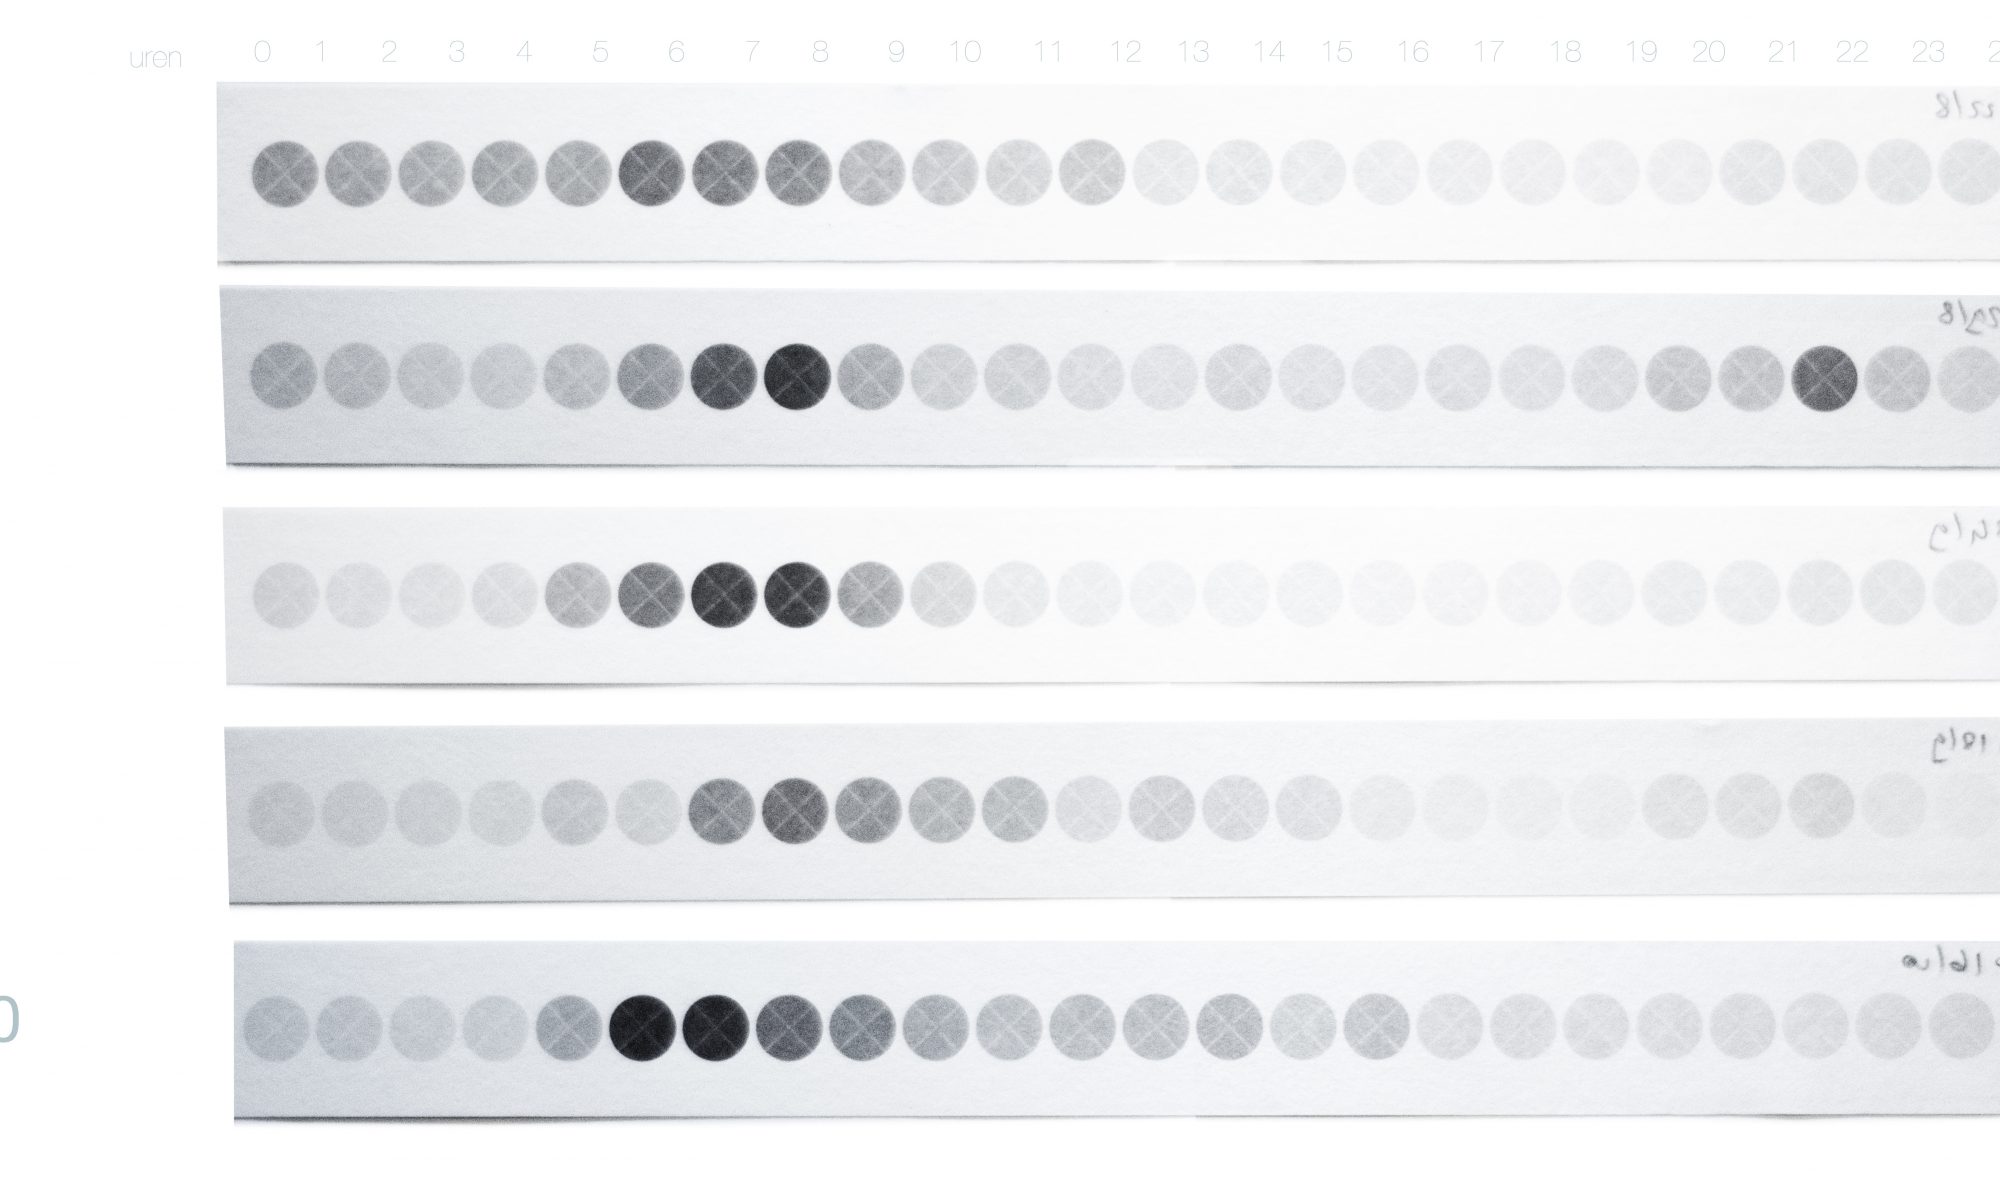
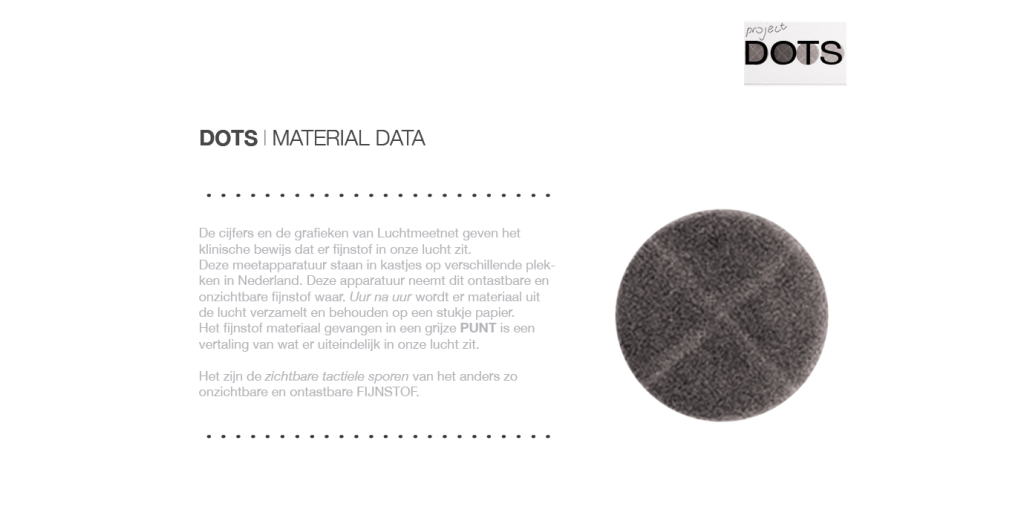
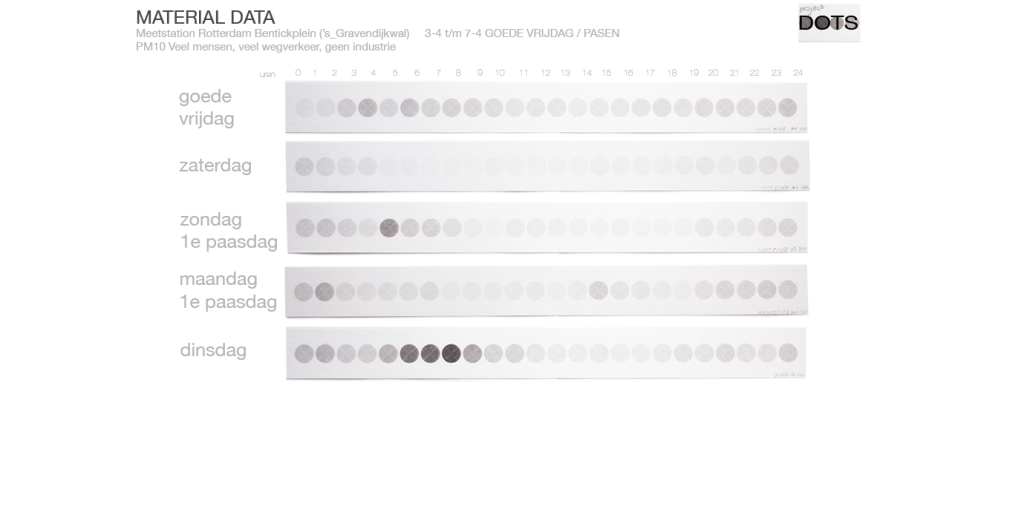
Dots was shown at the pop-up exhibition of City Lab Air Quality. Visualizing the invisible matter of air pollution. By literally showing the measurement material of the RIVM. These dots on paper come from a machine. It is giving the data by catching the fine dust in the air for 1 hour on a piece of paper, and then measuring with light reveals how much fine dust the paper contains. But the material itself tells a story! All the dots differ in grey tone. By comparing different locations and times it gives a visual insight of the air. The north of the Netherlands has almost white dots; Rotterdam ‘s-Gravendijkwal has dark grey and even black dots. The dots on New Years Evening are almost pinkish from the fireworks. A story of human behavior.
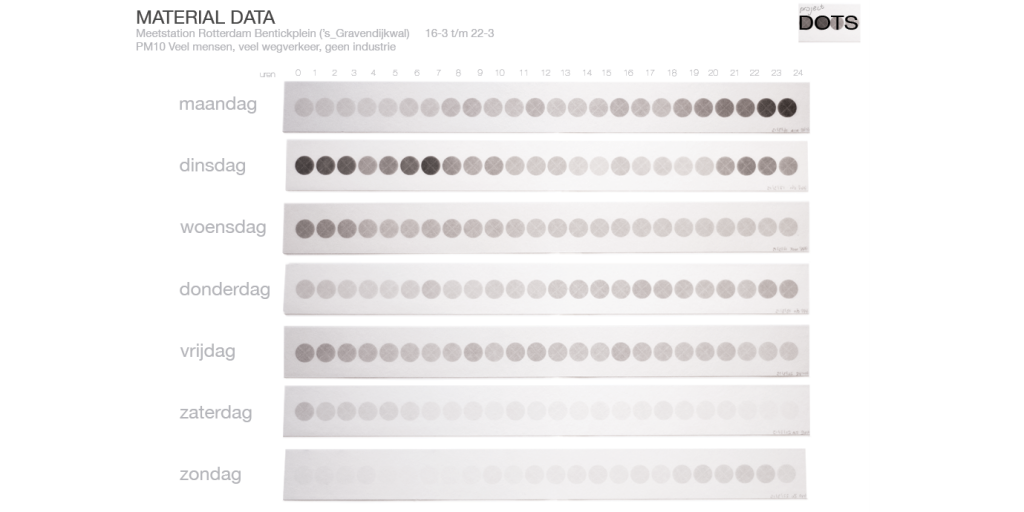
The dots reveal that the
‘s-Gravendijkwal during the week is a busy traffic location. On the weekend it is less busy, here you see the dots are much lighter of color.
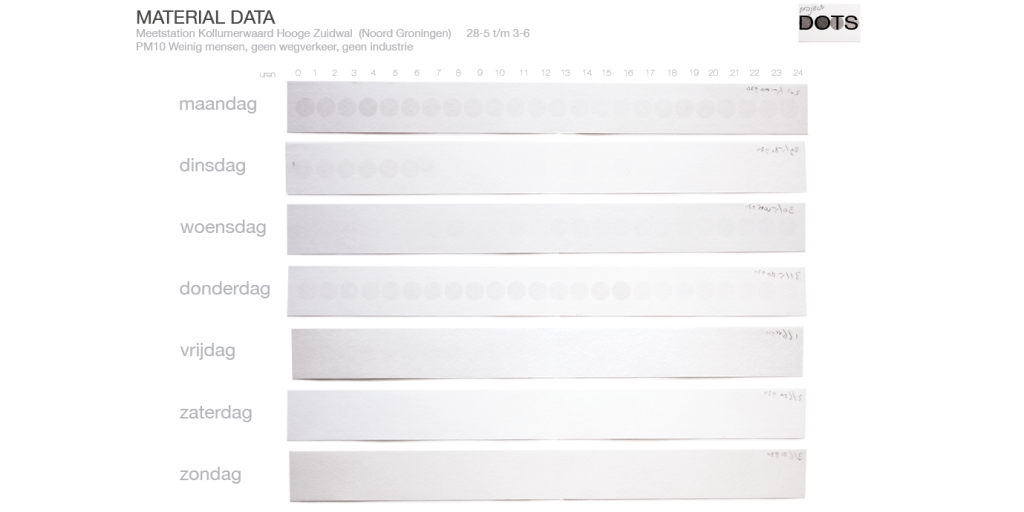
These dots show that the north of the Netherlands at the sea side, is less polluted.
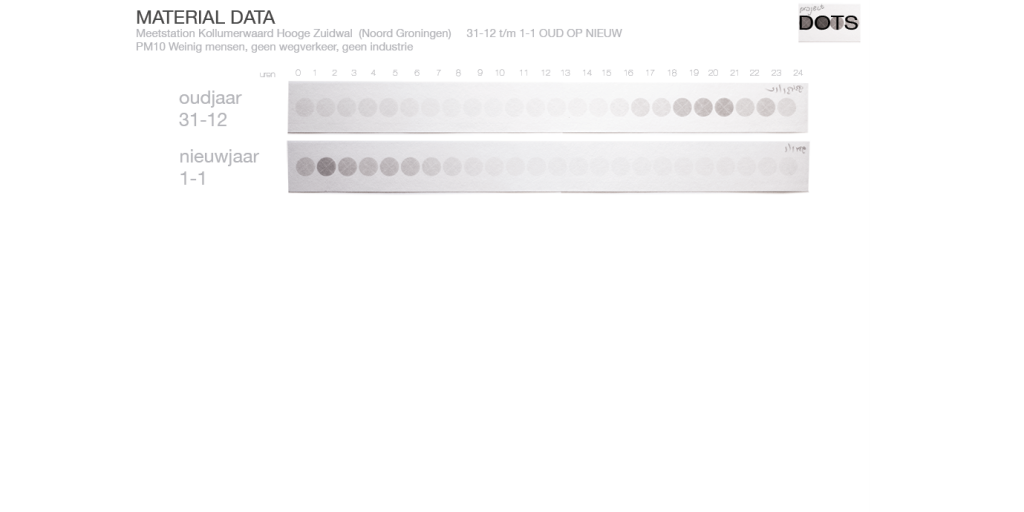
Here you see the effects of the fire works at the beginning of the new year also in the north of the Netherlands.
The Tuesday after the Easter weekend starts with a big traffic Jam on the ‘s-Gravendijkwal. The dots show the first working day.

These two images on the left show the the effect of traffic on the air quality. The top shows the dots at the same time and neighborhood, however it measures a high traffic street.
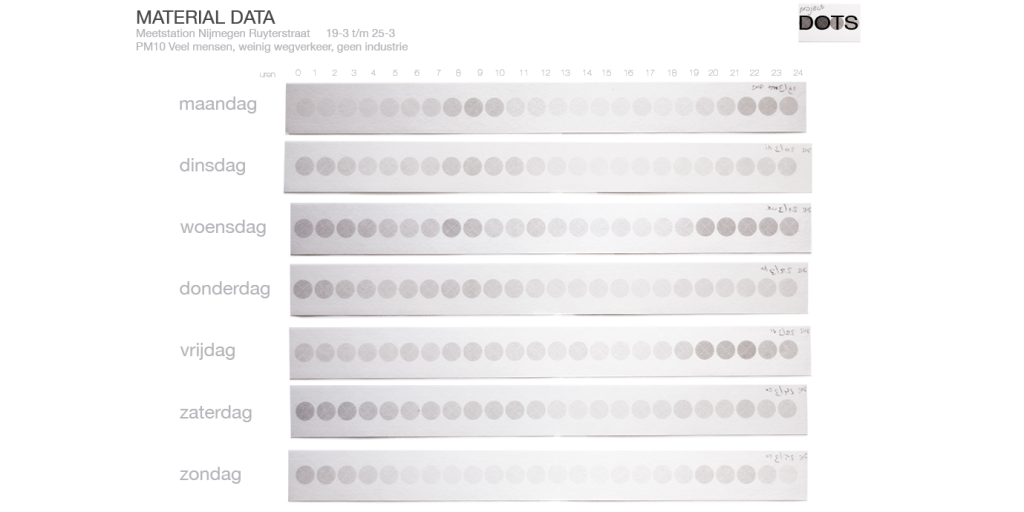
The one below is a quite street just around the corner. If you compare them you see that in the top one the dots are much darker.